ChemRxiv 2025 (Dhaka)
Type: Publication show more
ObjectId: 35885
Created: 11/9/2025 9:56:15 PM by A06) Dhaka Kapil [kapil.dhaka@uni-due.de]
Updated: 11/9/2025 11:47:47 PM by A06) Dhaka Kapil [kapil.dhaka@uni-due.de]
Access: Public Sort Code (asc): 0
License: CC BY 4.0
Description: K. Dhaka, H. M. A. Amin, D. Beschi, D. Schellenburg, B. Mockenhaupt, S. Barcikowski, S. Schulz, K. S. Exner, “Unifying Scaling Relations and Multiple Reaction Mechanisms for Screening 3d Transition-Metal-Doped Co₃O₄ for the Oxygen Evolution Reaction,” ChemRxiv , 2025, DOI: 10.26434/chemrxiv-2025-vnm2f.
File attached: unifying-scaling-relations-and-multiple-reaction-mechanisms-for-screening-transition-metal-doped-co3o4-for-oxygen-evolution-reaction.pdf 3.7 Mb
InfProject.Models.Reference - generic form start
ReferenceId: 35885
Authors list (comma-separated): K. Dhaka, H. M. A. Amin, D. Beschi, D. Schellenburg, B. Mockenhaupt, S. Barcikowski, S. Schulz, K. S. Exner
Title: Unifying Scaling Relations and Multiple Reaction Mechanisms for Screening 3d Transition-Metal-Doped Co₃O₄ for the Oxygen Evolution Reaction
Journal: ChemRxiv
Year: 2025
Volume:
Number (issue):
Start Page:
End Page:
DOI: 10.26434/chemrxiv-2025-vnm2f
URL: https://chemrxiv.org/engage/chemrxiv/article-details/68ecb0305dd091524f30b38a
BibTeX:
InfProject.Models.Reference - generic form end
Associated Objects
-
Active_site_identification_doped_Co3O4
Calculation/Computational SampleChange in the limiting free-energy span dGₘₐₓ(U) at U = 1.37 V vs RHE for undoped and different TM-doped Co3O4 systems. Bars represent the effect of different doping configurations: Undoped-Co3O4->Co (gold), Undoped-Co3O4->TM (turquoise), Co->TM (blue) and TM->2TM (orange). Negative values correspond to a reduction in Gₘₐₓ(U), which indicates a promoting effect of the respective dopant. Stars highlight the most favorable site configurations for each dopant.
promoting_effect.png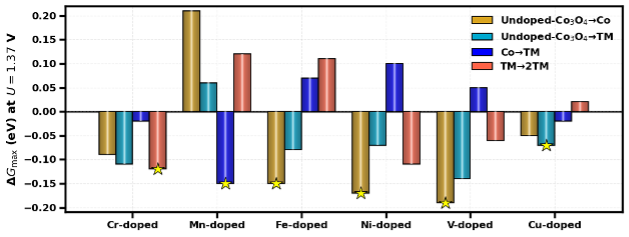
-
OER_Activity_doped_Co3O4
Calculation/Computational SampleGmax(U) heatmap for OER on doped Co₃O₄(001), showing the free-energy span Gmax as a function of applied potential U and dopants (Cr, Mn, Fe, Ni, Cu, V). Lower Gmax indicates higher predicted activity.
OER_Activity_doped_Co3O4.png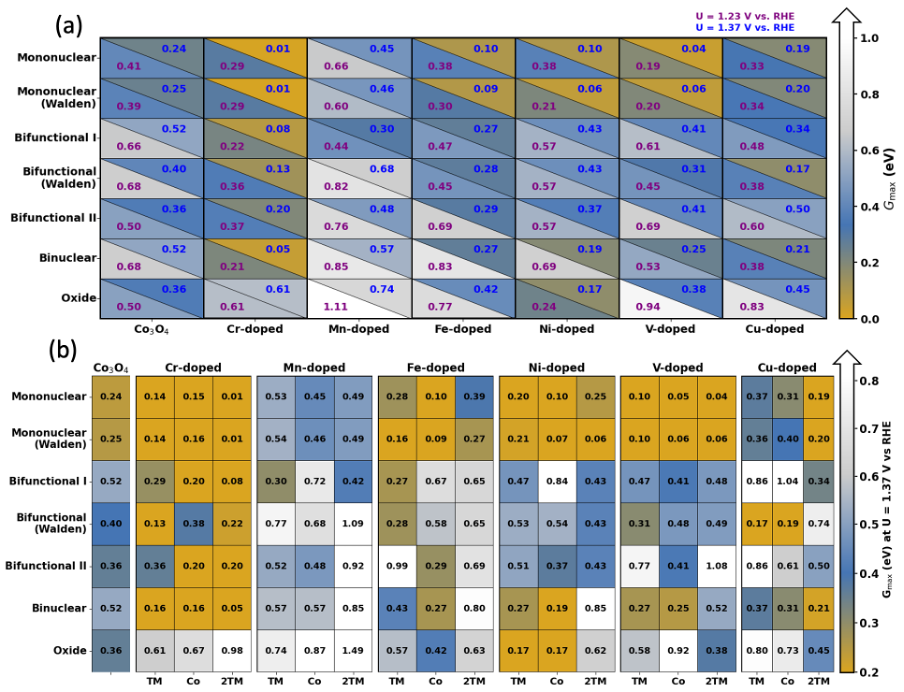
-
OER_volcano
Calculation/Computational SampleVolcano plot for the oxygen evolution reaction on doped Co3O4(001) models with additional information on the preferred reaction mechanism (marked in blue) as derived from the scaling relationships ΔG*OOH vs ΔG*OH and ΔG*O vs ΔG*OH at an applied electrode potential of U = 1.37 V vs RHE. The solid line with shaded bands represents the predicted activity trends based on the scaling relationships, and the shaded area indicates uncertainty of the trend line based on the error bars of the scaling relationships. The vertical dashed lines mark transitions in the energetically favored reaction mechanism, and the preferred mechanistic description is given in each dG*O – dG*OH regime. Note that the symbols correspond to the DFT data for the different dopants (Cr, Fe, Ni, Mn, Cu, V, and undoped Co3O4) at different active sites.
OER_volcano.png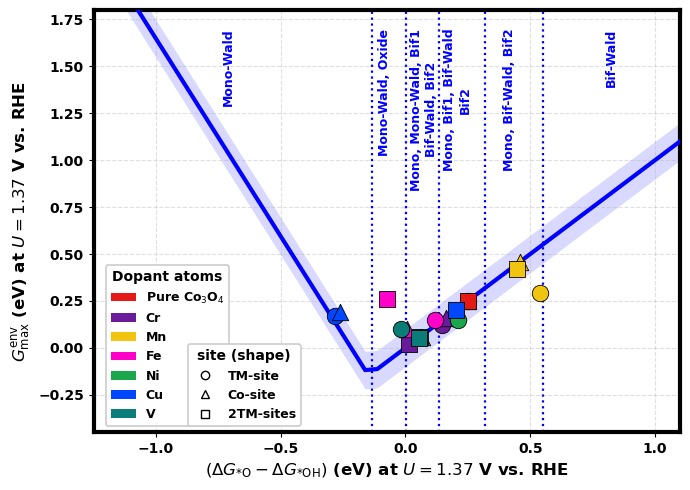
-
scaling_relation
Calculation/Computational SampleLinear scaling relationships between the OER intermediates (*OH, *O, and *OOH) for pristine and TM-doped Co3O4. (a) dG*OH vs dG*OOH, (b) dG*O vs dG*OH and (c). dG*OOH vs dG*O. Each data point corresponds to a specific dopant atom (Fe, Ni, Cr, Mn, Cu, V, or undoped Co3O4) and an active site type (TM, Co, and 2TM). The fitted regression lines are shown with confidence intervals (shaded regions), along with the slope, intercept, and coefficient of determination (R2).
ScalingRelation.png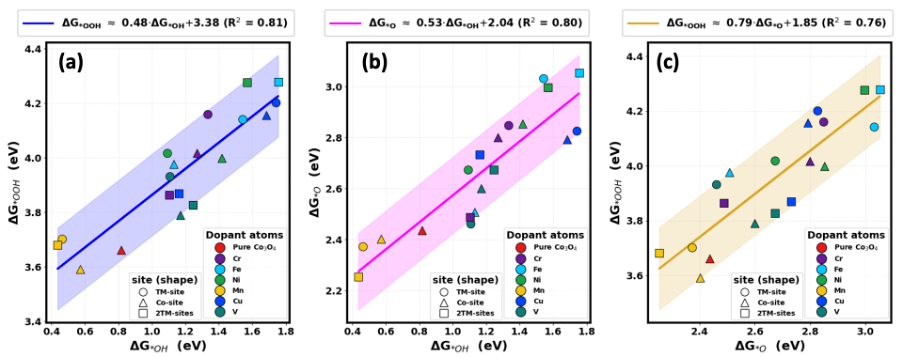
All properties (except table)
No properties found